Decoding Startup Financial Metrics: The Founder’s Complete Glossary

Tetiana Voronina
Pitch Deck & Presentation Strategist with a $125M+ Track Record | YC SS19
Being a first-time founder is an interesting but difficult life shift. The skills that helped you create a great product are different from the skills you need to build a great business. The biggest part of that shift is learning how to make your startup attractive to investors, and that requires a new language – financial metrics.
This guide is your startup financial metrics cheat sheet. We’ll provide a clear startup financial metrics definition for each term, show you practical startup financial metrics examples, and explain the meaning behind the numbers so you can lead with confidence.
Part 1: The Foundation – The 3 Core Financial Statements
Your entire financial model is built upon the 3-Statements. They are the bedrock of financial reporting and work together to provide a holistic view of your company. A Pro-Forma simply projects these statements into the future.
- Profit & Loss (P&L) Statement: Shows your financial performance over a period of time (a month, quarter, or year). It tells the story of your profitability.
- Balance Sheet: A snapshot of your company’s financial position at a single point in time, detailing what you own (Assets) and what you owe (Liabilities).
- Cash Flow Statement: Tracks the actual cash moving in and out of your company. It is the ultimate measure of your company’s ability to survive and operate.
Part 2: The Profit & Loss (P&L) Statement – Measuring Performance
The P&L is where you track your path to profitability.
- Revenue: The top-line income generated from your sales.
- COGS (Cost of Goods Sold): The direct costs to deliver your service (e.g., hosting, third-party APIs, direct support labor).
- Gross Margin: Your Revenue – COGS. This shows the core profitability of your product.
- Operating Expenses (OpEx): The ongoing costs to run the business.
- R&D (Research & Development): Costs to build and maintain your product.
- S&M (Sales & Marketing): All costs associated with acquiring customers.
- G&A (General & Administrative): Overhead costs like salaries, rent, and software.
- Operating Profit (EBITDA): Earnings Before Interest, Taxes, Depreciation, and Amortization. A key metric for your core operational performance.
- D&A (Depreciation & Amortization): Expensing the cost of your long-term assets (PP&E Assets and Intangibles Assets) over their useful life.
- EBIT (Earnings Before Interest & Taxes): EBITDA – D&A. Shows profit from core business operations.
- Interest: The cost of any borrowed money (Loan).
- Profit Before Tax (EBT): Your profit before income taxes are deducted.
- Net Profit: The “bottom line”—your profit after all expenses are paid.
Part 3: The Balance Sheet – A Snapshot of Financial Health
The Balance Sheet must always balance: Assets = Liabilities + Equity.
Assets: What You Own
- Assets: All economic resources controlled by your company.
- Current Assets: Assets you expect to convert to cash within a year.
- Cash / Cash Equivalent: The funds in your bank accounts.
- Account Receivable (Days Sales Outstanding – DSO): Money owed to you by customers. DSO measures how quickly you collect it.
- Long Term Assets: Assets with a lifespan of more than a year.
- PP&E Assets (Property, Plant, and Equipment): Tangible items like laptops and office furniture.
- Intangible Assets: Non-physical assets like patents or trademarks.
Liabilities: What You Owe
- Liabilities: Your company’s financial obligations.
- Current Liabilities: Debts due within one year.
- Accounts Payable (Days Payable Outstanding – DPO): Money you owe to suppliers. DPO measures how quickly you pay them.
- Short Term Loans: A Loan due within one year.
- Deferred Revenue: Cash received from customers for services you have not yet delivered. A critical liability for subscription businesses.
- Long Term Liabilities: Debts due after one year.
- Long Term Loans: A Loan with a term of more than one year.
Equity: The Owners’ Stake
- Equity & Retained Earnings: Represents the ownership stake in your company.
- Shareholders’ Equity (or Owners’ Equity): The net worth of the company (Assets – Liabilities).
- Retained Earnings: Profits that are reinvested back into the business instead of being paid out to shareholders.
- Current Equity: The present value of the ownership stake.
Part 4: The Cash Flow Statement – Tracking Your Lifeblood
This statement reconciles your Net Profit back to the actual change in your cash balance. It is the ultimate truth of your business’s health.
- Operating Cash Flow: The cash generated from your core business operations.
- Investing Cash Flow: Cash used for or generated from investments. This includes:
- Capital Expenditures (CapEx): Funds used to acquire or upgrade long-term assets like PP&E Assets.
- Financing Cash Flow: Cash flow between a company and its owners/creditors. This includes:
- Equity Investments: Cash received from investors in exchange for Shares.
- Loan: Cash received from or paid to lenders.
- The Cash Reconciliation:
- Beginning Cash Balance: The cash you started with.
- Change In Cash: The net result from all the cash flows above.
- Ending Cash Balance: The cash you end the period with (Beginning Cash Balance + Change in Cash).
Part 5: Essential SaaS & Fundraising Metrics
These are the metrics investors will scrutinize in your financial model to assess your growth potential and capital efficiency.
SaaS Recurring Revenue Metrics
- Recurring Revenue: The portion of your company’s revenue that is predictable and likely to continue.
- MRR (Monthly Recurring Revenue): Your predictable revenue on a monthly basis.
- ACV (Annual Contract Value): The value of a subscription contract over a 12-month period.
- ARPA (Average Revenue Per Account): The average revenue you get per customer (MRR / Total Customers).
- Churn: The rate at which you lose customers or revenue. A critical measure of customer satisfaction and product-market fit.
Founder & Fundraising Metrics
- Burn Rate: The speed at which your company is spending its capital.
- Gross Burn: Your total monthly expenses.
- Net Burn: Gross Burn – Revenue. This is your actual monthly cash loss.
- Average Monthly Burn: Your Net Burn averaged over several months.
- Runway: The number of months you can operate before you run out of cash (Total Cash / Net Burn).
- Breakeven run rate: The revenue level needed for your Net Burn to become zero.
- Shares: Units of ownership interest in a corporation or financial asset.
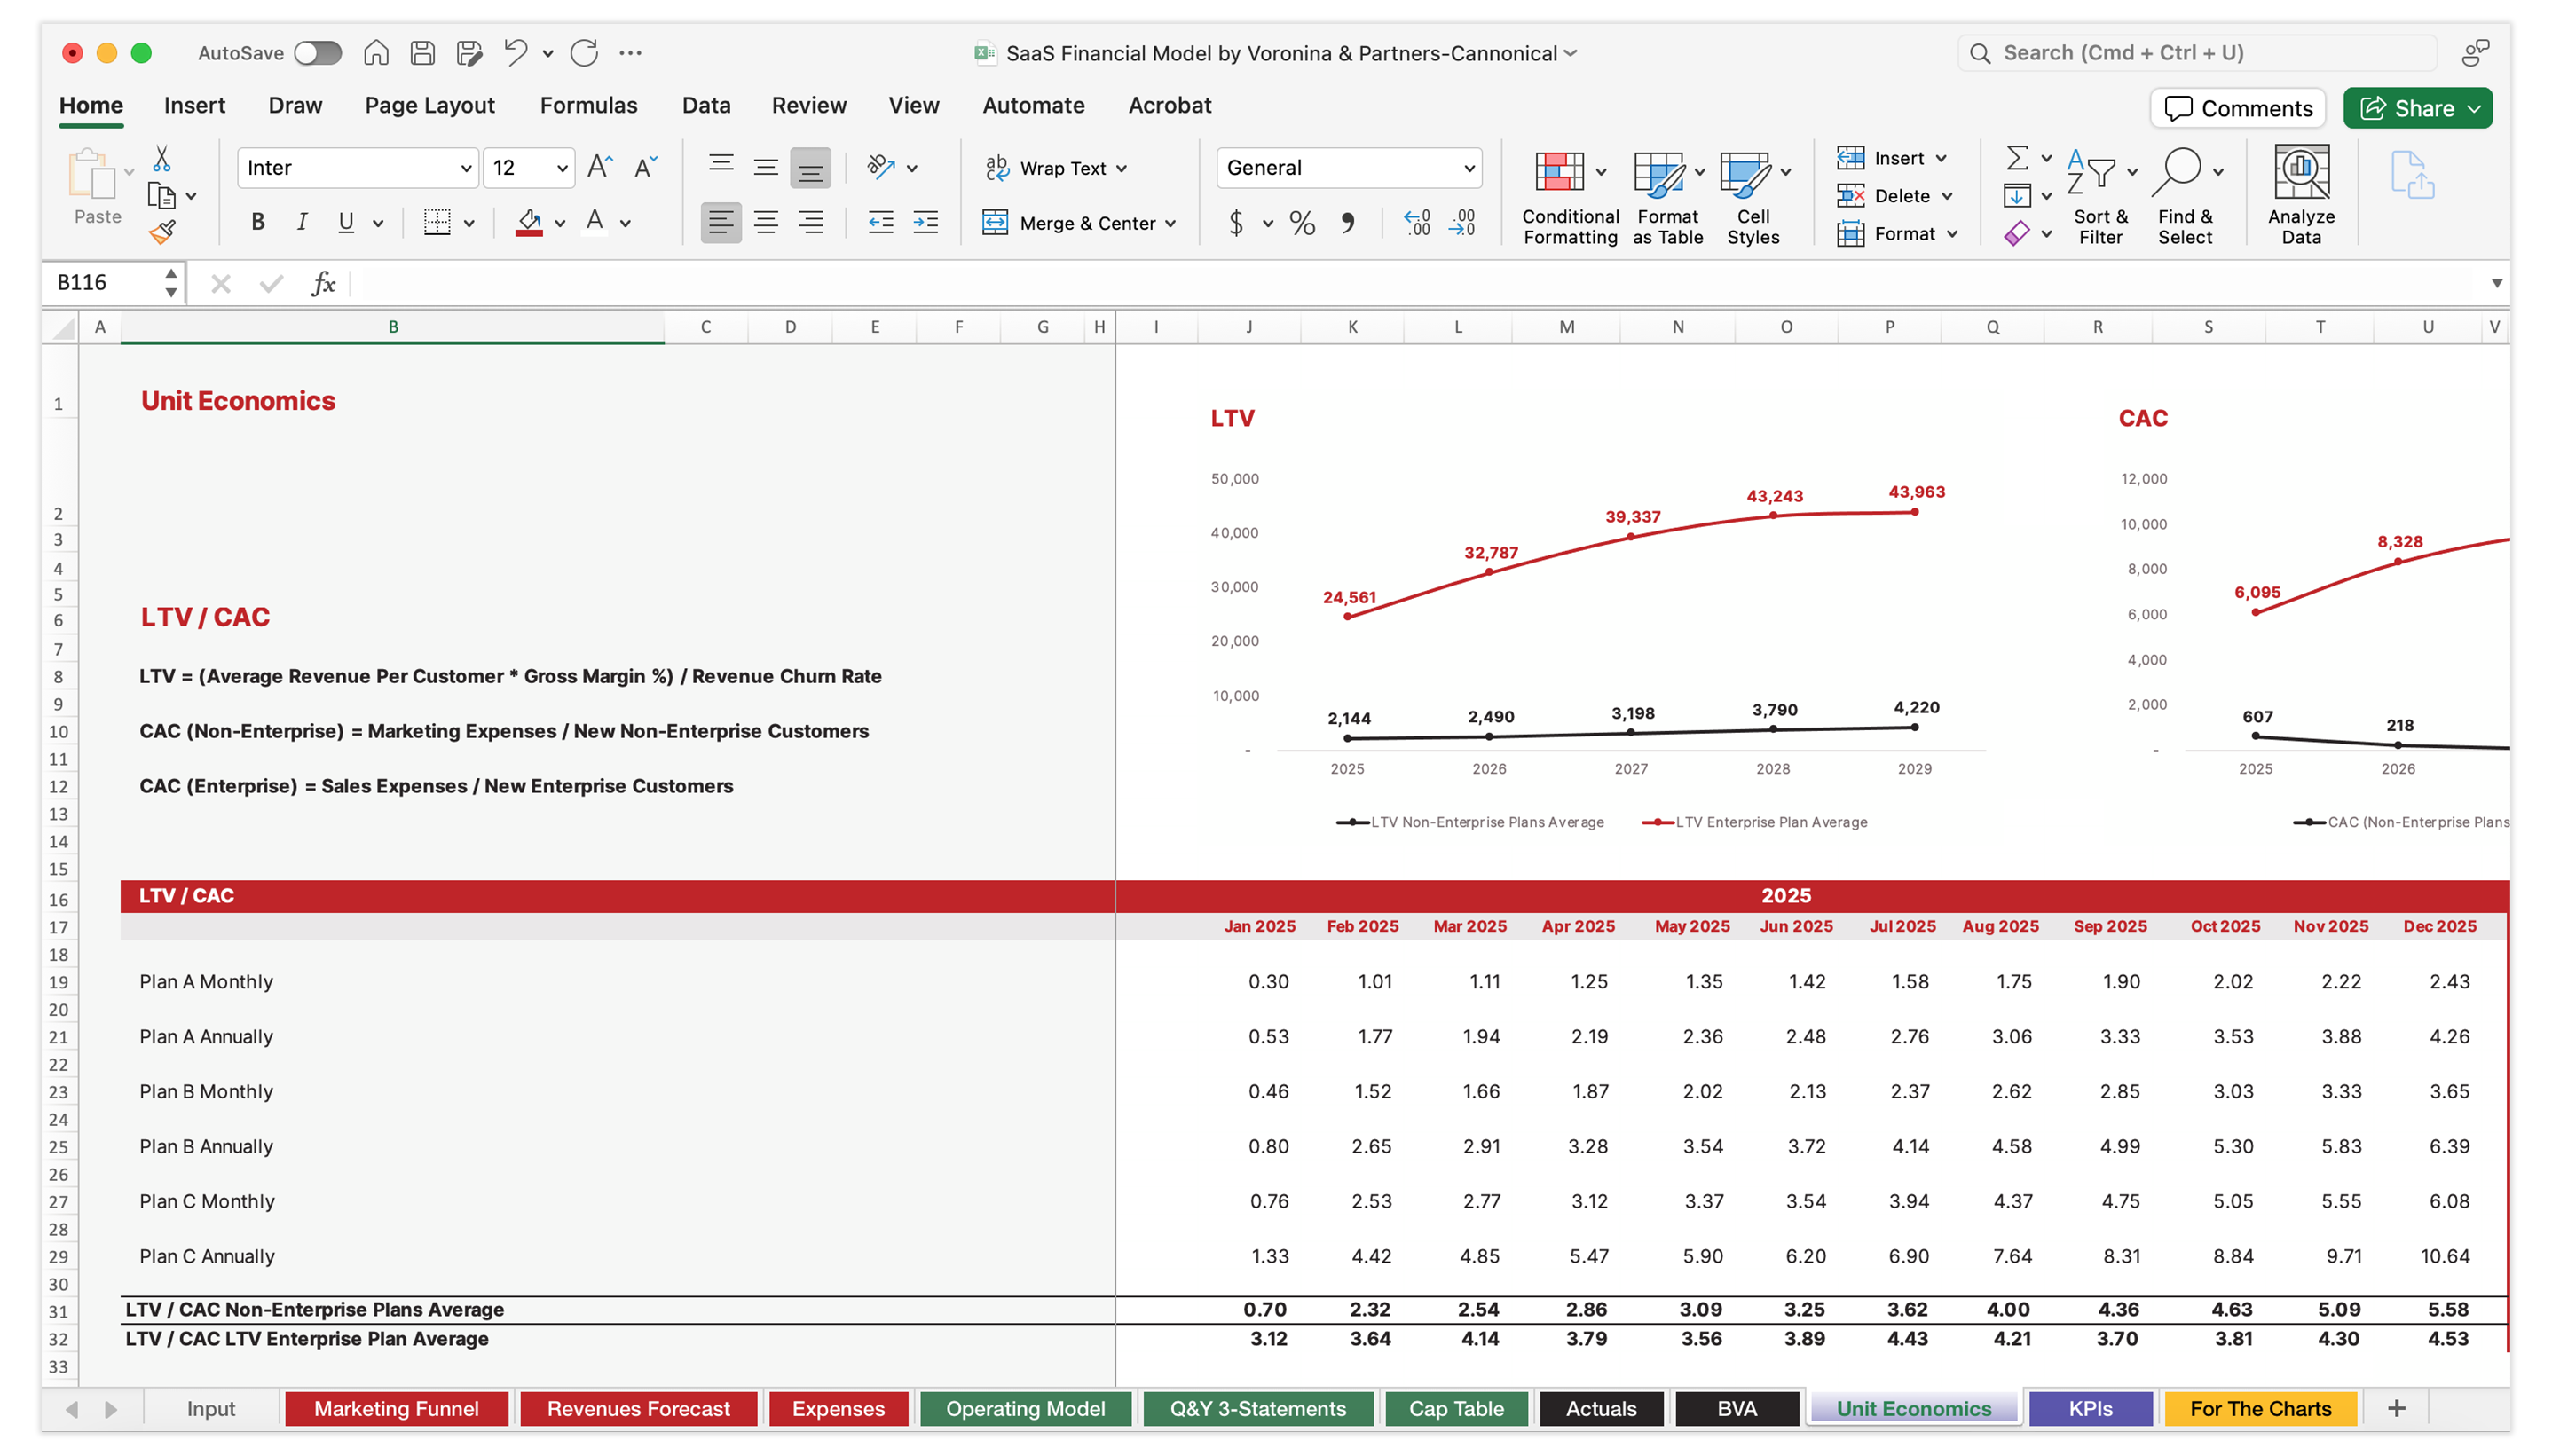
- Unit Economics: The direct revenues and costs of a single customer.
- LTV (Customer Lifetime Value): The total profit you can expect from a single customer over their entire time with you.
- CAC (Customer Acquisition Cost): The total cost to acquire one new customer.
- LTV / CAC Ratio: A critical ratio that compares customer lifetime value to customer acquisition cost. A healthy ratio is typically 3:1 or higher.
- CAC Payback: The number of months it takes to earn back the money you spent to acquire a customer.
Don’t Just Understand It – Raise with Confidence.
You’ve mastered the vocabulary of startup finance. Now it’s time to use that language to walk into any investor meeting with total confidence.
A powerful, investor-ready financial model and a compelling pitch deck are the two critical assets that give you this confidence. They are how you prove your business is a smart investment and translate your vision into a story that wins.
You don’t need to start from a blank page. To accelerate your progress, we’ve developed a suite of DIY tools – from ex-KPMG verified financial models to a curated library of 100+ investor-proven pitch deck slides. These are toolkits designed for founders like you to take control of your narrative and build a Pitch Deck that gives you the confidence to get funded.
It’s time to build your investor-ready pitch. Explore our founder-focused tools and build a story that wins.
Frequently Asked Questions (FAQ)
Which financial metric is commonly used to evaluate a startup's performance?
The LTV / CAC ratio is a critical metric for evaluating a startup’s performance. It measures the long-term value of a customer against the cost to acquire them, showing the sustainability and efficiency of the business model.
Which financial metric is most commonly used to assess a startup's profitability?
EBITDA (Operating Profit) is the most common metric used to assess a company’s core operational profitability. For overall “bottom-line” profitability, Net Profit is used.
What is the most important metric for a startup?
For an early-stage startup, the most important metrics are Net Burn and Runway. These directly relate to cash flow, which is the lifeblood of the company and determines how long it can survive.
Which financial metric is used to evaluate a company's financial performance?
A company’s financial performance is evaluated using a combination of metrics from the P&L statement, including Revenue, Gross Margin, and Operating Profit (EBITDA) to see how well the company generates profit from its core operations.
What is the most commonly used financial performance measure?
Operating Profit (EBITDA) is one of the most widely used financial performance measures because it shows the results of a company’s primary business activities, independent of its financing or tax strategy.
What is the most commonly used measure of profitability?
Net Profit is the ultimate and most commonly used measure of profitability, as it represents the total earnings after every single expense, tax, and interest payment has been deducted from revenue.

About Author
Tetiana Voronina is a Pitch Deck and Presentation Strategist, Founder and CEO of Voronina & Partners Marketing Solutions, and a YC SS19 attendee. She specializes in comprehensive fundraising preparation, crafting the compelling narratives that have cumulatively raised $125M+ in funding.


